A NEWS TERMINAL FOR
PEOPLE WHO TRADE HEADLINES
News breaks.
We check our scores.
A headline hits the wire. Seconds later it's on the board with an impact score, the instruments it touches, and what funding, liquidations and the prediction markets are doing around them. The score is triage: it decides what is worth your attention, not how far price will travel. We measure the difference and publish it, which is more than we can say for the last news score anyone sold you.
CALIBRATION2,081 MEASURED · 1,028 UNMEASURABLE · 83 PENDINGNo card, no trial clock. The feed, the globe, the heatmap and the entire calibration ledger are free to read.
Pulled off the live pipeline when this page was built. It rebuilds every five minutes.
What actually happens to a headline in here.
One item first, followed from the connector that carried it to the instrument it was tagged to. Then five more, in the order they landed. These are the scores the engine actually gave them — nothing on this page is a mock-up.
8-K - Quoin Pharmaceuticals Ltd. (0001671502) (Filer)
AI ANALYSIS · NOT FINANCIAL ADVICE
The same thing, five more times
Plenty of free sites will show you that something happened somewhere. Working out which instruments care, and what those instruments are already doing, is the part that took the work.
Every row below arrived through the same four stations. The score and the asset tags get attached on the way in, so the board is already sorted by the time you look at it.
- IMP 6
8-K - Quoin Pharmaceuticals Ltd. (0001671502) (Filer)
edgar:8k10:35 UTCregulatoryNO ASSET TAG - IMP 6
$GM GENERAL MOTORS Q3 EARNINGS ADJ. EPS $3.70, EST. $3.56 REV. $50.02B, EST. $48.53B…
tg:marketfeed10:33 UTCmarketNO ASSET TAG - IMP 6
GENERAL MOTORS ($GM ) BEATS Q3 EARNINGS EXPECTATIONS Q3 Results: 🔸 Revenue: $50.02B vs.…
tg:walterbloomberg10:33 UTCmarketNO ASSET TAG - IMP 6
GENERAL MOTORS APPROVES NEW $20B SHARE BUYBACK || SEES FY ADJ EPS $12.75 TO $13.75, SAW…
tg:marketfeed10:33 UTCmarketNO ASSET TAG - IMP 6
$MMM 3M Q3 Earnings Adj. EPS $2.50, est. $2.38 Rev. $6.6B Adj. Oper margin 26.2%, est.…
tg:financialjuice10:33 UTCmarketNO ASSET TAG
It tells you what to ignore
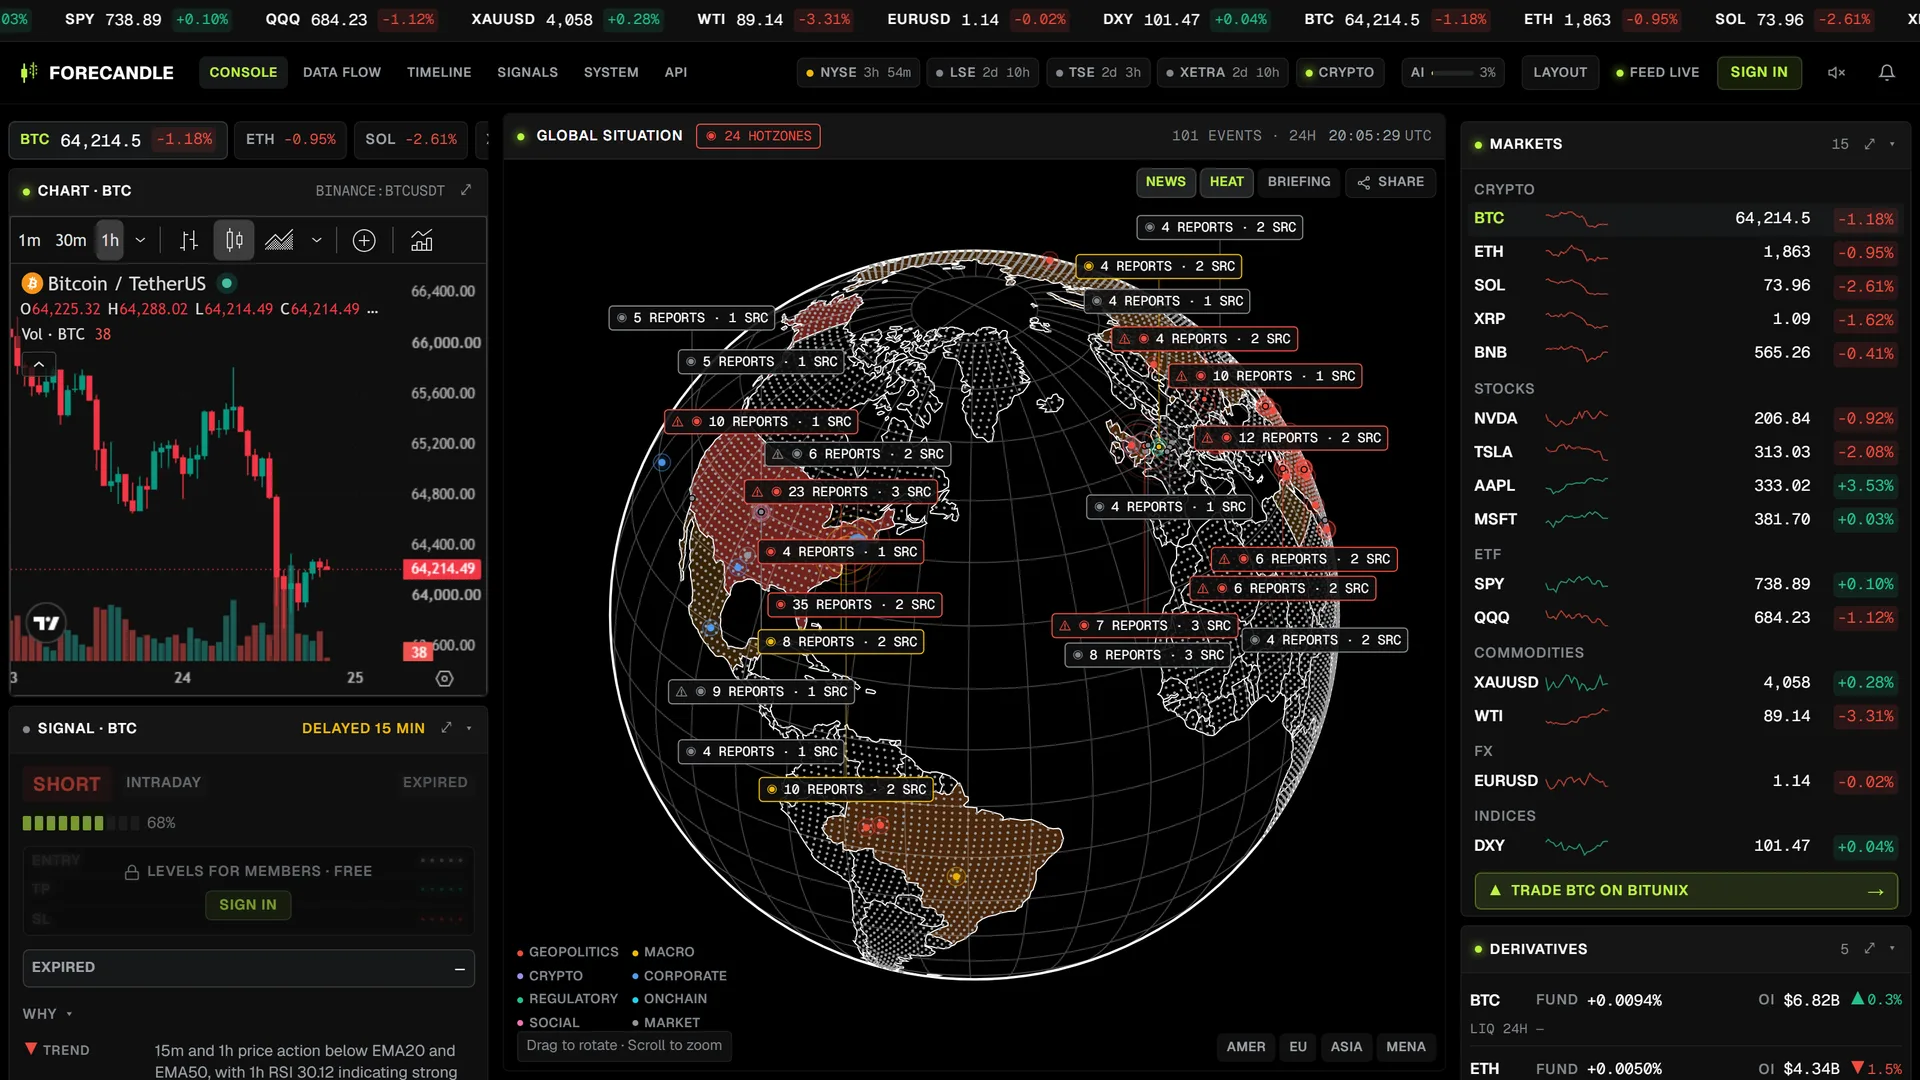
A headline reaches the board already carrying an impact score, a category and its tagged assets. 3,395 events came through in the last 24 hours. Almost all of it is noise, and the score exists so you are not establishing that one headline at a time.
One story, one screen
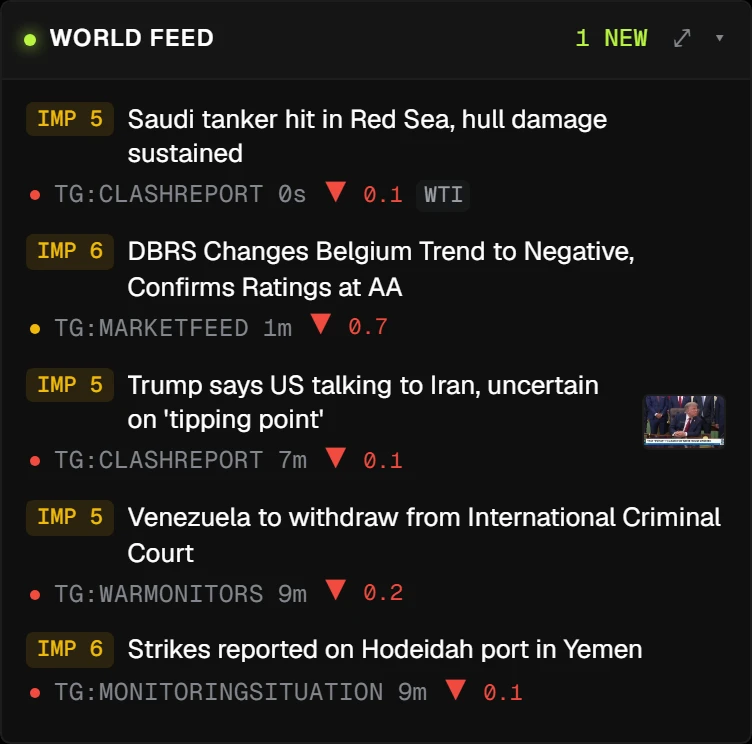
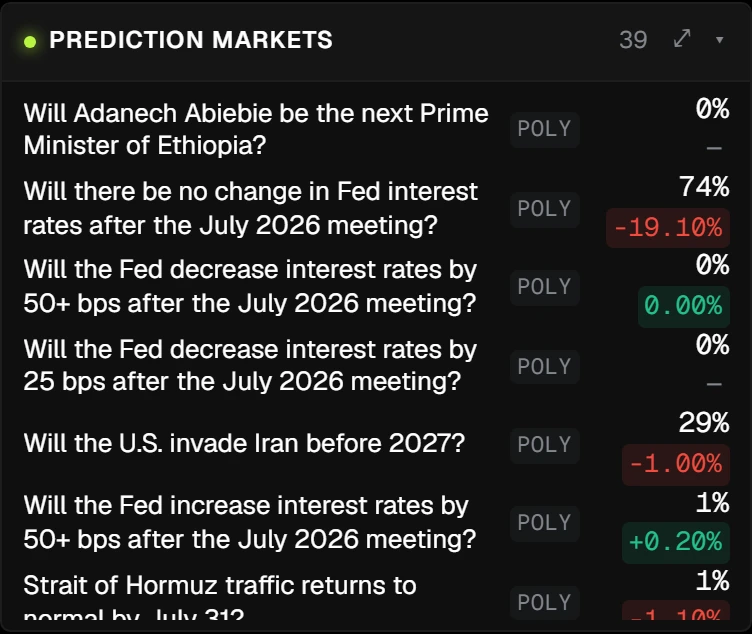
The event, the instruments it touches, funding and open interest, the liquidation structure around the current level, and any prediction-market contract trading on the same question. Most of that exists free somewhere. Lining it up against the same event, in the same second, is the annoying part.
And we publish what the scores were worth
Every scored headline books its own price measurements. 2,081 of them resolved in the last 30 days, 1,028 could not be measured at all, and that second number is published as loudly as the first. Read the whole thing, including the event classes where the study found nothing.
What happens between the wire and your screen.
Four steps, all of them running as you read this. The screenshots are the console itself, not mockups.
- 01
A headline lands
Newswires, exchange feeds, SEC filings, economic releases and a handful of social relays are read continuously. When six outlets carry the same story, the near-identical copies get folded into one event, so the board doesn't fill up with the same thing six times.
- 02
Impact, 0 to 10
Every event gets a triage score within a few seconds of arriving, plus a category and a direction. Someone shilling a coin scores 0 and drops off the board. A strike on a shipping lane scores 7 and stays there. It is a sorting instrument, not a forecast of how far price travels, and the calibration page publishes how well it does the sorting.
- 03
Instruments, and a place on the map
The event is tagged to the instruments it can move and pinned to wherever it happened. When several reports land in the same region they cluster into a hotzone, so a fortnight of wire items about one conflict reads as one situation instead of forty pins.
- 04
The market, next to the story
Then it sits beside live price, funding and open interest, the liquidation structure around the current level, and any prediction-market contract trading on the same question. That last one matters more than it sounds — the odds usually move before the commentary does.
Four families of feed, two routes, one lake.
News is de-duplicated and scored before it is stored. Price, derivatives and prediction-market data run straight into the time-series store. Both ends land in the same lake, which is the only reason a market can sit beside a story in the same second.
News is de-duplicated, scored and stored. Market, derivatives and prediction-market feeds run straight into the time-series store. Both land in the same lake, and the measurement worker reads from there: every scored headline gets its price measurements booked and resolved out of the same store.
The routes and the connector counts come off the same health endpoint the console reads. The moving dots are the shape of the flow, not a tick-by-tick feed — the version wired to the socket, where every particle is one real datum, is inside the product.
What the pipeline actually counted.
Every figure below is read off the same API the console uses, at the moment this page was built. Nothing is rounded up and nothing is a projection.
One caveat while you are reading counters. Events have only recently started being kept for longer than a day, so the archive is shallow and the “what moved last time this happened” view isn't built yet. The live half works today. The historical half needs a few more months of retention behind it.
The parts that aren't allowed to guess.
Something has to read the text — thousands of items a day do not get read by hand. Nothing downstream of that takes it on trust. The arithmetic, the risk checks and the published measurements all run in ordinary code you can reason about, and a finalized measurement has no edit path.
- SHAPEObject, required fields present, right types.PASS
- DIRECTIONlong, short or hold. Nothing else is a call.PASS
- STOP SIDEStop on the losing side of the entry.REJECT
- ENTRY DRIFTEntry within 10% of live price.PASS
- SIZE · LEVERAGESize from stop distance. Leverage clamped.PASS
Every number is recomputed in code
Nothing reaches the board because something suggested it. Every field is validated before it is stored, and an item that fails validation is dropped rather than patched up with a plausible guess. On the trading side the rules are blunter, and they are the ones in the gate above: a stop on the wrong side of entry is rejected, an entry more than 10% from live price is rejected, confidence under 40 is forced to a hold, position size is recomputed from the stop distance instead of accepted, and leverage is clamped. Those rules exist because fluent and correct are different properties.
The ledger cannot be edited
Every scored headline schedules its own price measurements, each one freezing the impact score, both price endpoints and the timeframe it was measured on. A finalized row is immutable and there is no delete path for one anywhere in the codebase. Measurements the stored candle history cannot resolve are published as unmeasurable, with the reason, rather than dropped — which is the whole difference between a denominator and a percentage. Read the whole ledger, including the event classes where it found nothing.
It degrades instead of going dark
Three paths, in order. When the one above fails — an error, a timeout, output that will not parse, an outage, or the daily spend cap — the next one picks the item up and nothing downstream notices. The bottom rung needs no network at all, which is the whole reason it is there. A feed that stops during the one hour it mattered is worse than a feed that says plainly it is running on its floor.
Reads every inbound item and hands back structured fields: impact, category, direction, region, dedupe.
A different supplier, wired in as an automatic retry rather than a manual switch. Nothing downstream notices.
A plain keyword-and-source scorer, no network calls. Lower confidence, clearly marked, still a working feed.
MEASURED HISTORY, NOT A PERFORMANCE PROMISE · NOT FINANCIAL ADVICE
We measure whether our own scores mean anything, and we publish the answer.
Including when the answer is no. Every scored headline books its own price measurements, the ones that could not be resolved are counted in the denominator rather than dropped, and the study that grades each class of event publishes the classes where it found nothing beside the ones where it found something. It is all on one public page, with the endpoints printed on it, so you never have to take our word for any of it.
Every score schedules its own test
When the engine scores a headline, it books a set of price measurements on the assets it tagged — at 15 minutes, an hour, four hours and a day. Nobody chooses which ones get published afterwards. There is no delete path for a finalized measurement anywhere in the codebase.
The measurements we could not take are counted too
Free data feeds only keep daily candles for most stocks, FX and commodities, so a fifteen-minute reading on them can never resolve. Those rows are published as unmeasurable with the reason attached, instead of being dropped — dropping them would quietly bias every number on the page toward the assets with intraday history.
The answer today is mostly no, and we print it
A separate study grades each class of event against a same-hour baseline with confidence intervals. Most classes come back with nothing: no direction that survives the interval, or too few clean observations to say anything at all. Those verdicts sit on the page next to the handful that did show something, at the same size.
What that leaves the impact score good for: sorting the queue. It decides which few dozen of several thousand daily items are worth your attention, and that is a real job. It is not a forecast of how far price will travel, we do not sell it as one, and the calibration page is where you check that for yourself.
One rule can watch the news, the price, the funding and the liquidations at once.
This is the part that is genuinely hard to assemble out of free tools. Each of those feeds is free somewhere; having a single rule read all four and reach you when the tab is closed is not. Rules run server-side, so nothing depends on a browser being open.
Fire when a scored event clears an impact threshold — optionally only in the categories, assets or regions you care about.
Fire when a quote crosses a level you set, on any instrument on the watchlist.
Fire when perpetual funding goes above or below a rate, which is usually the first sign a crowd has stacked on one side.
Fire when realised liquidations pass a dollar figure inside a window you choose.
Delivery, and the honest small print
Every rule delivers in-app and by browser push. Pro adds email, which also needs a confirmed address — it is re-checked at the moment a rule fires, so an unverified inbox silently dropping alerts is not a failure mode we allow. Each rule carries its own cooldown so a noisy hour cannot turn into forty notifications.
The caps are enforced server-side, and the plan is re-checked when a rule fires rather than only when you create it.
What the money actually buys.
The feed, the globe, the heatmap, the odds and the whole calibration ledger are open to anyone, with or without an account. Pro buys capacity and delivery: fifty alert rules instead of three, email as well as push, unlimited positions, briefings on demand and deeper API history. The ledger never moves behind the wall — a proof you have to pay to read is not a proof.
- The full event feed, globe and hotzones
- Liquidation heatmap and market structure
- Prediction-market odds
- The complete calibration ledger, denominators included
- Everything in Public, in real time
- Three alert rules, in-app and browser push
- Paper positions, notifications and the desk chat
- An API key, commercial use allowed
- Fifty alert rules, and email delivery as well as push
- Unlimited open positions, fifty desk messages a day
- Generate the daily briefing on demand
- Deeper API history and higher rate limits
Annual comes to $24.17 a month, which is 2 months off the monthly price. Cancel from the billing portal whenever you like.
The questions people actually ask.
What is Forecandle?
A real-time event terminal for traders. It reads newswires, exchange feeds, filings, economic releases and social relays continuously, scores every incoming headline for how much attention it deserves, tags it to the instruments and the place it affects, and sets it beside live price, derivatives positioning, liquidation structure and prediction-market odds. What you get out of it is speed: within seconds you know whether a headline is worth looking at and what it touches. Then it measures what actually happened to price afterwards and publishes that too.
How is this different from a free news globe?
The free globes tell you an event happened. Forecandle puts a market next to it. Behind each pin sit live candles, funding and open interest, the liquidation structure around the current level, positioning data and the prediction-market contracts trading on the same story, plus a public API. Drawing the pin is the cheap part.
Which markets does it cover?
Crypto majors, US equities and index ETFs, gold, crude, the dollar index and the major FX pairs. Events are tagged to the instruments they can plausibly move, so a strike on a shipping lane surfaces against crude and gold rather than against whatever coin happens to be trending.
Does the impact score predict how far price will move?
No, and we publish the measurement that says so. The score is triage: it decides which few dozen of several thousand daily items are worth your attention. When we measured what price actually did afterwards, the buckets carrying almost all the volume came out close together, and a separate study that grades each class of event against a same-hour baseline returned no measurable edge for most classes and too small a sample to judge many of the rest. All of it is on the calibration page with its denominators. If a competitor tells you their score predicts move size, ask them for the same page.
Is there a track record, and can I check it?
Yes, and it is free, complete and unflattering. Every scored headline books its own price measurements at 15 minutes, 1 hour, 4 hours and a day, on each asset it was tagged to. The calibration page publishes what those measurements found, together with how many could not be taken and why, and the graded verdict for every class of event including the classes where nothing was found. A finalized measurement has no delete path anywhere in the codebase, the endpoints are printed on the page, and they need no key and no account, so you can pull the rows and redo the arithmetic yourself.
What is free and what costs money?
The event feed, the globe, hotzones, the liquidation heatmap and market structure, prediction-market odds and the entire calibration ledger are free, and so is an API key with commercial use allowed. A free account adds three alert rules delivered in-app and by push. A subscription raises that to fifty rules and adds email delivery, lifts the cap on open positions, raises the daily desk-chat allowance, unlocks briefing generation on demand and gives deeper API history and rate limits.
Do you sell trading signals?
No. The subscription is the terminal, the alerts and the ledger. There is a signals surface inside the product and it is currently empty; we are not charging for it, not advertising it and not counting it as a reason to subscribe. If it ever carries anything again it will arrive on the same terms as everything else here: timestamped, scored against what price did, and published with its denominator whether or not the result flatters us.
How accurate is the liquidation heatmap?
Realized liquidations are genuine exchange data, streamed from the venues' own forced-order feeds. The projected heatmap is a different animal: it estimates where leveraged positions sit from candle volume and a fixed leverage distribution, and it never looks at open interest. Read it as structure, not as measurement.
Is there an API?
Yes. Candles, events and metrics over a documented REST API with commercial use permitted on the free key, plus the calibration ledger and the graded event classes on public endpoints that need no key at all. Free keys get 30 days of candle history and 7 days of events; paid keys get the full stored history and higher rate limits.
Does it use AI?
For the reading, yes — thousands of items a day do not get read by hand. It is deliberately not the last step, and it does none of the arithmetic. Every field that comes back is validated before it is stored and malformed output is dropped rather than guessed at, while the numbers that decide anything — position size, leverage, the outcome of every published call — are computed in ordinary code. There is a second path if the first one errors, times out or returns something unparseable, and under both of those a deterministic keyword-and-source scorer that needs no network at all, so the feed keeps running on a lower-confidence score instead of going dark. Which suppliers sit on which rung is not published: it is competitive information and it changes.
Open it the next time something breaks.
You don't need an account to look around. The feed, the globe, the heatmap, the odds and the whole calibration ledger are open, and that isn't a launch promotion.